Estimated reading time: 5 minutes
I saw this chart posted by a crypto technical analyst on LinkedIn showing the probability of when Bitcoin will bottom this cycle. As a crypto investor, I found this intriguing because it offers a clear prediction about timing. Timing is a major concern for anyone in the space. Driven by curiosity about its accuracy, I visited the site for more details.
The chart above is located on the Crypto Technical Analyst website.
Quick links to parts of this article:
- About the Bitcoin probability chart
- Is the Bitcoin probability chart accurate?
- Bitcoin price and MVRV-Z chart
- More data obtained
- Interview with the analyst
- 4-year cycle
- 3 Key data points from the analyst
- Confluence
- Is Bitcoin a computer program?
- Conclusion
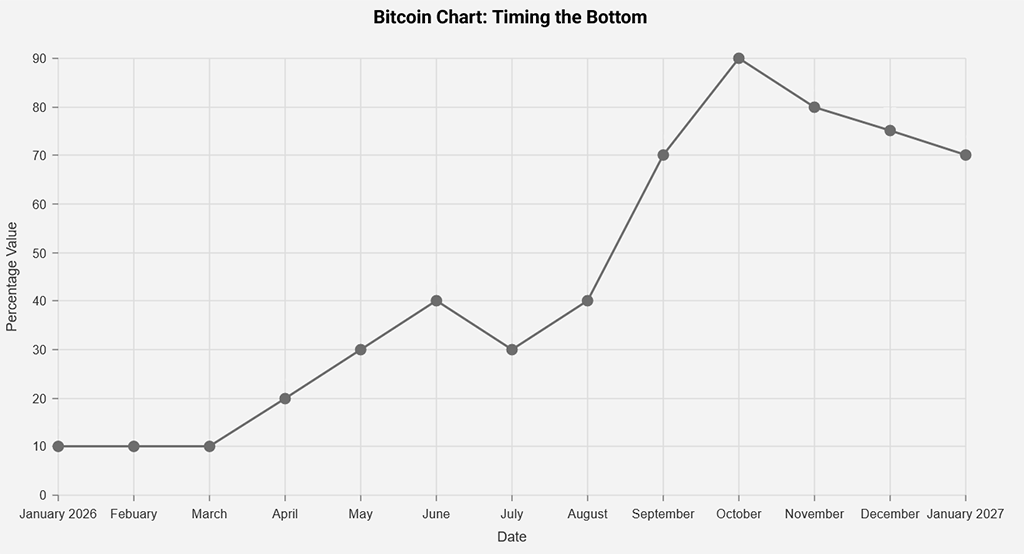
Probability of When Bitcoin Bottoms
The chart, featured on the Crypto Technical Analyst website, shows that the odds of Bitcoin finding a bottom are highest in October. The percentage starts to increase on the chart to 70% in September. According to the website, the window to watch is from October to January.
In the article, the analyst does say, “There was one cycle that lasted slightly over a year.”
Is the Probability Chart Accurate?
Starting at the top of the article titled, “When will Bitcoin Bottom This Cycle?” This is the same page where the probability chart is midway down. The crypto technical analyst says one of the charts he uses is called the MVRV-Z, which has signaled the bottom of every Bitcoin cycle. This data goes all the way back to the beginning of Bitcoin.
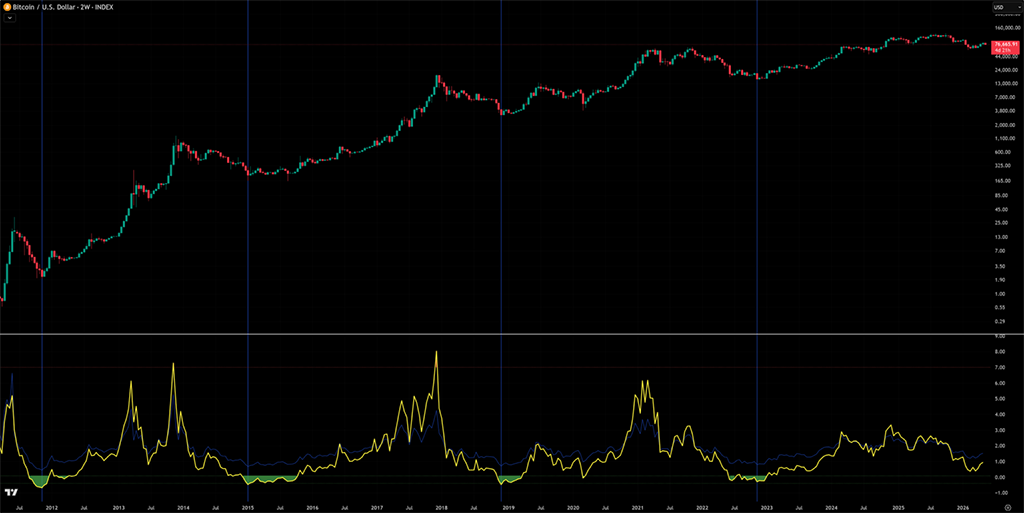
This chart is available for download (hi-res) on the website, so you can zoom in on it. The green on the MVRV-Z chart represents the fair value of Bitcoin. I’m liking what I’m seeing here so far with the MVRV-Z chart. I’m definitely going to see if I can find this indicator over on Tradeview.
The MVRV-Z chart clearly shows Bitcoin hasn’t bottomed yet.
What we do not know by reading this one article is whether the MVRV-Z is the data he uses for the probability chart. After reading more on his website. Looks like he uses a bunch of data points that are built into the probability chart.
More Data
Read this article about: The Only Chart You Need to Trade Bitcoin and Win. I didn’t know trading Bitcoin could really be that simple. This article also aligns with his Bitcoin probability chart that I found on LinkedIn.
Interview with the Analyst
I reached out to Jason Gillespie, the crypto analyst through email and received a response. After interviewing and talking with him, it makes more sense. The data he uses for the Bitcoin probability chart does come from many different sources.
4-Year Cycle
Lately, I’ve been hearing a lot about how the Bitcoin 4-year cycle is dead. If true, wouldn’t this nullify his projections? The crypto technical analyst says, “The Bitcoin 4-year cycle is alive and well. I have the data to prove it.”
The analyst says Bitcoin does the same thing every 4 years on a very similar timeline. If a cryptocurrency does the same thing every four years, how can you bet against that? I think your odds are much better to bet with history than against it.
3 Key Data Points:
- Time-based: On average, Bitcoin bottoms 1 year after its last top. (Accurate)
- Time-based using the halvings: On average, from the last halving, Bitcoin bottoms out 800-1000 days later. (Ball park)
- Multiple historic charts and indicators: Align with the time-based information above. (Most Accurate)
Confluence
He goes on to explain that he uses time-based data, historical charts, and indicators to make these projections. The analyst says, “I simply can’t bet against history, which has proven itself time and time again. The only way I could ever go against history is if we see Bitcoin drop to 35-42K before these dates.”
Programming
“Bitcoin is like a program or application. This is how I see Bitcoin, and the price action behaves similarly, repeating the same pattern every 4 years with diminishing returns. Always remember that the Bitcoin code was written by a programmer. Look at Bitcoin as a computer program.“
Conclusion About Crypto Technical Analyst
This was a fun interview with the crypto technical analyst. Definitely learned some things. Go over and read through the website. He’s got a bunch of recently published articles about Bitcoin. You can find all of the articles listed on the Bitcoin technical analysis page.
Here’s one of the articles not mentioned above.
I’m definitely following this guy to see if his analysis is correct. Looks like he has a Facebook page too. If it turns out this guy is right, I will write another article showing how accurate his crypto technical analysis is.
And of course, if this guy’s right, we’re going to make him our go-to crypto technical analyst for the website. We need an analyst who knows what he’s doing. Who doesn’t? Crypto is volatile and hard to predict.
You May Also Be Interested In
We recently put out an article titled “When Will the Crypto Bull Market Start?” So I was definitely interested in investigating this further.